Document your Architecture with Diagrams
This quick post will highlight the python package diagrams, which aims to provide a toolkit for diagrams as code. This is a fantastic toolkit that empowers us to use code to drive documentation.
This library has a large number of use-cases, but for me, this boils down to technical documentation that can help visualize:
- Architecture reviews
- Technical prototypes (e.g. ETL, app stack, data product)
- ML pipelines
To get started, it’s as easy as
pip install diagramsN.B. If you are developing locally, you will need to ensure that you have
graphvizinstalled. See link link for more.
With that behind us, let’s use the example from the docs
from diagrams import Diagram
from diagrams.aws.compute import EC2
from diagrams.aws.database import RDS
from diagrams.aws.network import ELB

with Diagram("Web Service", show=False):
    ELB("lb") >> EC2("web") >> RDS("userdb")
Which will render the following diagram:
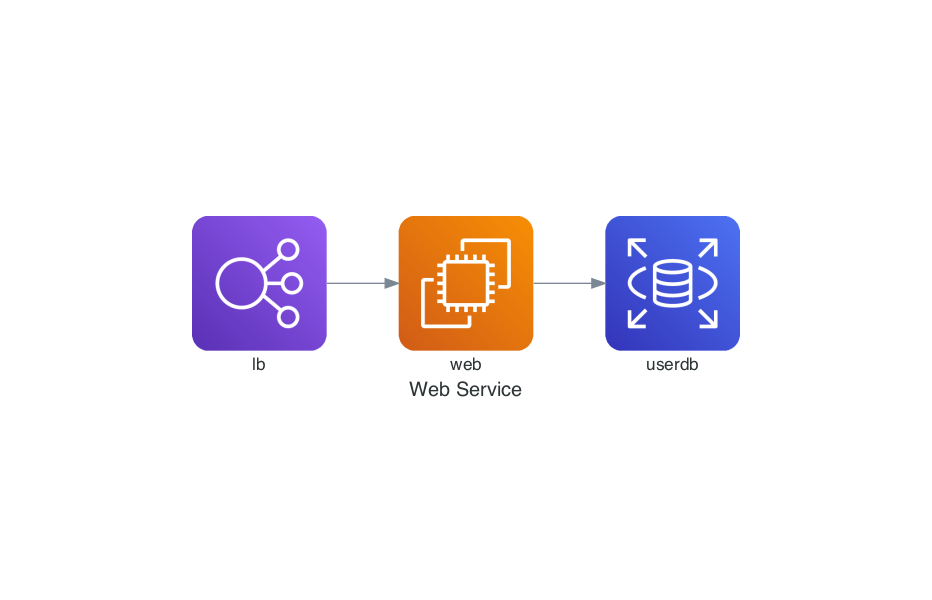 Let’s call out a few amazing bits from above:
- The code creates an image file that we can use downstream. Above, the resulting file is
web_service.png. This may not be obvious at first, but customizable based on your approach. - We can leverage the iconography (i.e. product logo) from a wide range of technologies and cloud providers.
- What’s more, you can also control the labels of these nodes in the diagram. I find this to be helpful when prototyping ideas for feature tickets or tech design meetings with devs/engineers.
- This is reproducible and removes the need to drag-and-drop updates in GUI tools.
The last item above could be viewed as both a strength and a weakeness from a “risk” point-of-view. Using code to build our diagram is reproducible, but does impose a more technical approach when balanced against drag/drop GUI apps.
How about some other examples?
Clusters/Groups of Services
from diagrams import Cluster, Diagram
from diagrams.aws.compute import ECS
from diagrams.aws.database import ElastiCache, RDS
from diagrams.aws.network import ELB
from diagrams.aws.network import Route53
with Diagram("Clustered Web Services", show=False):
dns = Route53("dns")
lb = ELB("lb")
with Cluster("Services"):
svc_group = [ECS("web1"),
ECS("web2"),
ECS("web3")]
with Cluster("DB Cluster"):
db_main = RDS("userdb")
db_main - [RDS("userdb ro")]
memcached = ElastiCache("memcached")
dns >> lb >> svc_group
svc_group >> db_main
svc_group >> memcached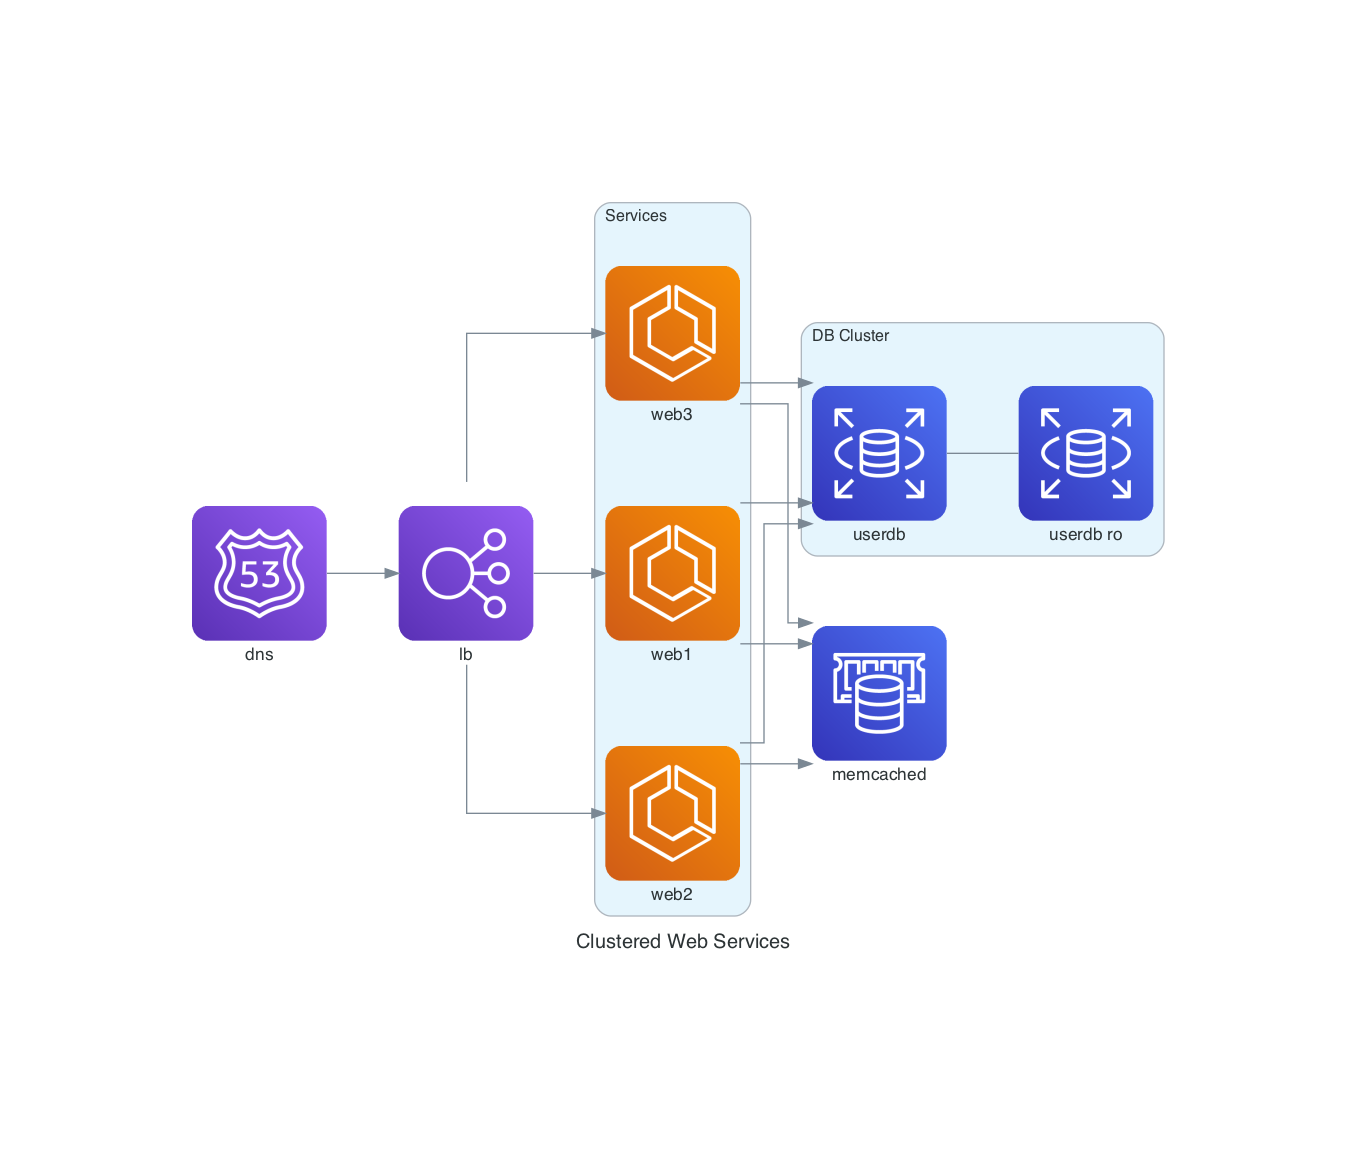 How cool is that?!?